Pioneer Elite PRO-730HD 64" CRT rear projection HDTV
This shows graphs of RGB levels, color temperature, luminance, gamma and CIE diagrams of Carl's Pioneer Elite PRO-730HD 64" CRT rear projection HDTV
before and after a calibration using an Eye One Display LT colorimeter and HCFR analysis software. Some additional adjustments may be made,
but the image quality is incredibly nice now. Some screen shots have been added to the end of the page.
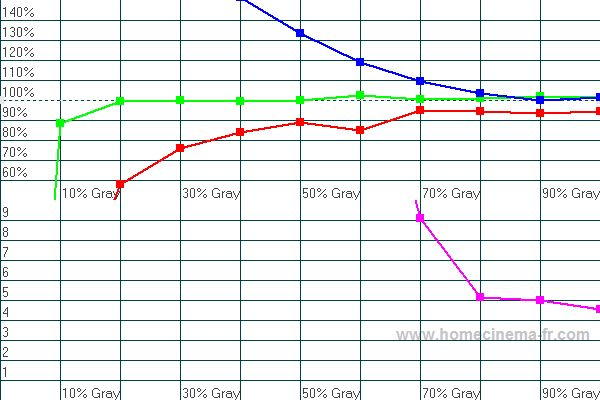
RGB Levels
Ideally the red, blue and green levels should all be at 100% all the way from black (0%) to white (100%). This allows the TV to produce neutral grays of any intensity.
The purple curve shows the percentage away from ideal at each level of gray. This line would be at 0 for a perfect RGB level.
Before: Notice how the blue curve goes off the scale as the picture gets darker, while the red drops off.
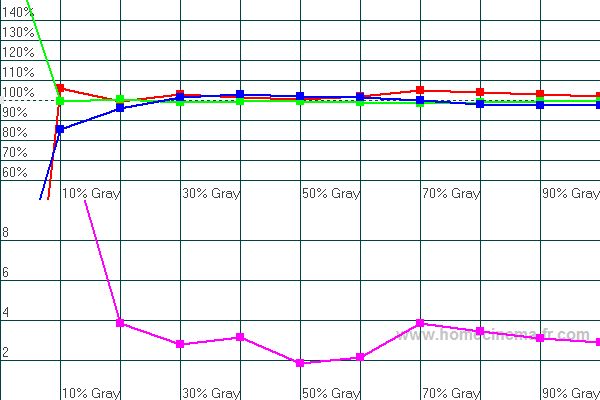
After: Now the red, blue and green all track pretty equally all the way from very dark to white. The far leftmost point is black, so the divergence there isn't visible on screen.
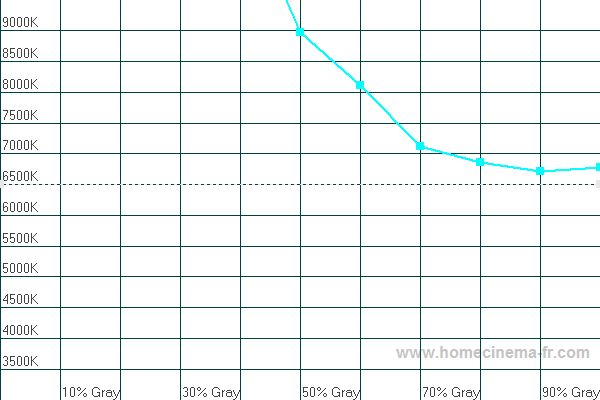
Color Temperature
The proper "color temperature" is 6500K all the way from black (0%) to white (0%).
Before: Clearly the color temperature is completely wrong because of how far off the red the blue curves above were.
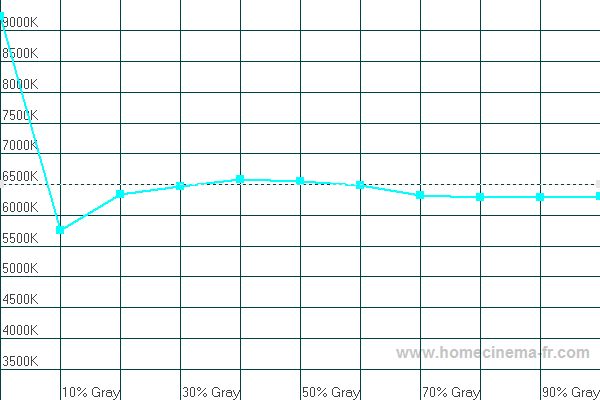
After: Now the color temperature tracks very closely to ideal.
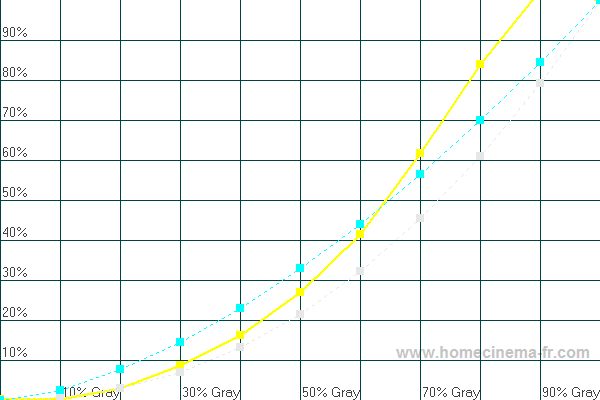
Luminance
Luminance is a measure of light output at different shades of gray. The yellow curve is the TVs actual luminance, while the light gray dotted curve is the reference luminance we wish to achieve.
Before: Initially the TV was putting out too much light at all shades of gray.
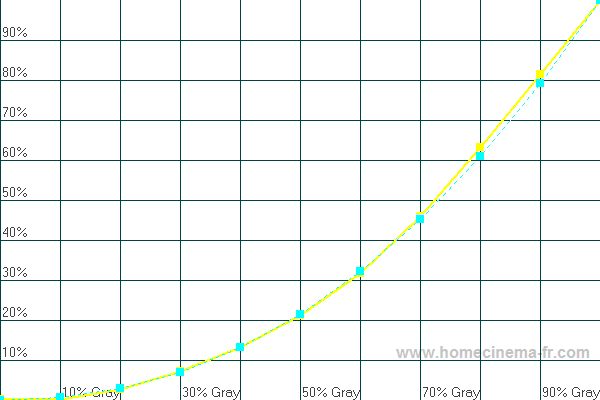
After: Now the light output is nearly spot-on the desired amount.
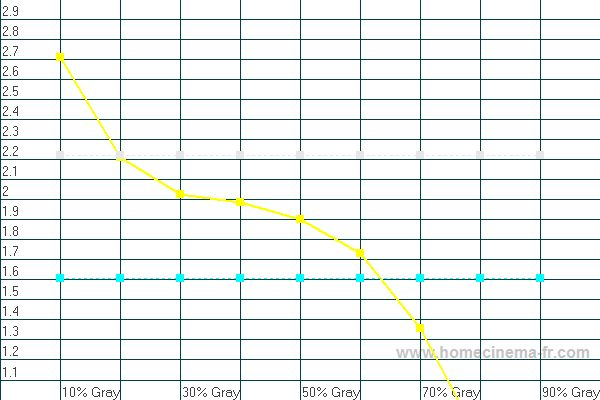
Gamma
Gamma is a measure of light output at different gray levels. Gamma is mainly a choice about shadow detail vs. darkness of blacks. A gamma higher than 2.2 will give a higher contrast
ratio and deeper blacks, but it also reveals less detail in dark scenes.
Before: The average gamma was so far below the desired gamma, but it was too high in the very dark areas, while dropping off way too much above 20% gray.
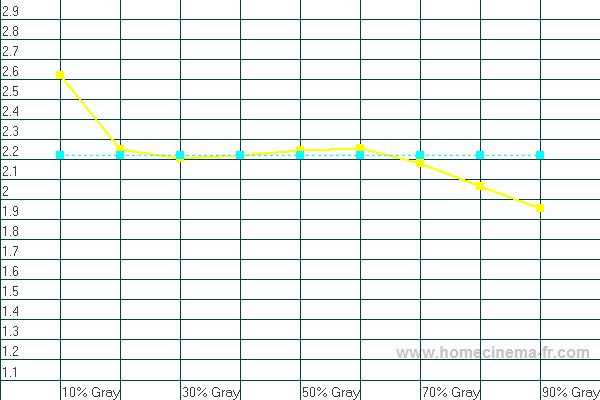
After: The average gamma is now nearly exactly ideal with only slight variances at the low and high ends.
CIE Diagram
The CIE diagram shows information about the primary colors (at the corners), secondary colors (in between the corners), color temperature and grayscale. The diamonds with the crosses in
the middle are the standard definitions of each color that we strive to achieve. The solid circles are the measured colors of the TV. It is usually not possible to adjust the TV to
achieve correct definitions of the colors, so we try to find the best balance overall. The white circles in the middle are the different shades of gray. Ideally they should all line up
at the D65 mark.
Before: The primary colors are close to the HD standard, but 2 of the 3 secondary colors were off a bit. Also the grayscale points are almost all off the D65 point in the center.
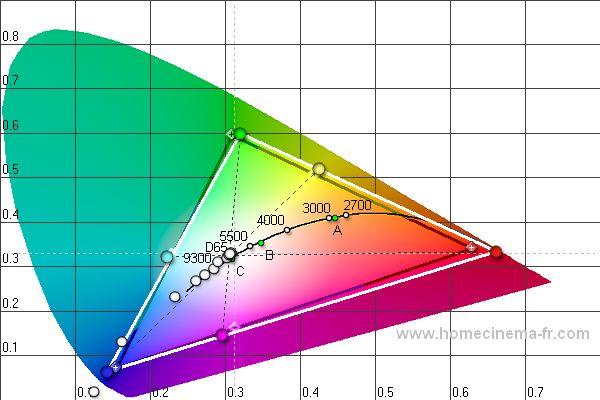
After: The primary colors are about the same, but now 2 of the 3 secondary colors are right on, while the grayscale points are almost all on the D65 point in the center.

Screen shots
The following are screen shots of Transformers on the TV, taken with a Canon A95 5MP digital camera.